Analytics
In The Dashboard Tab
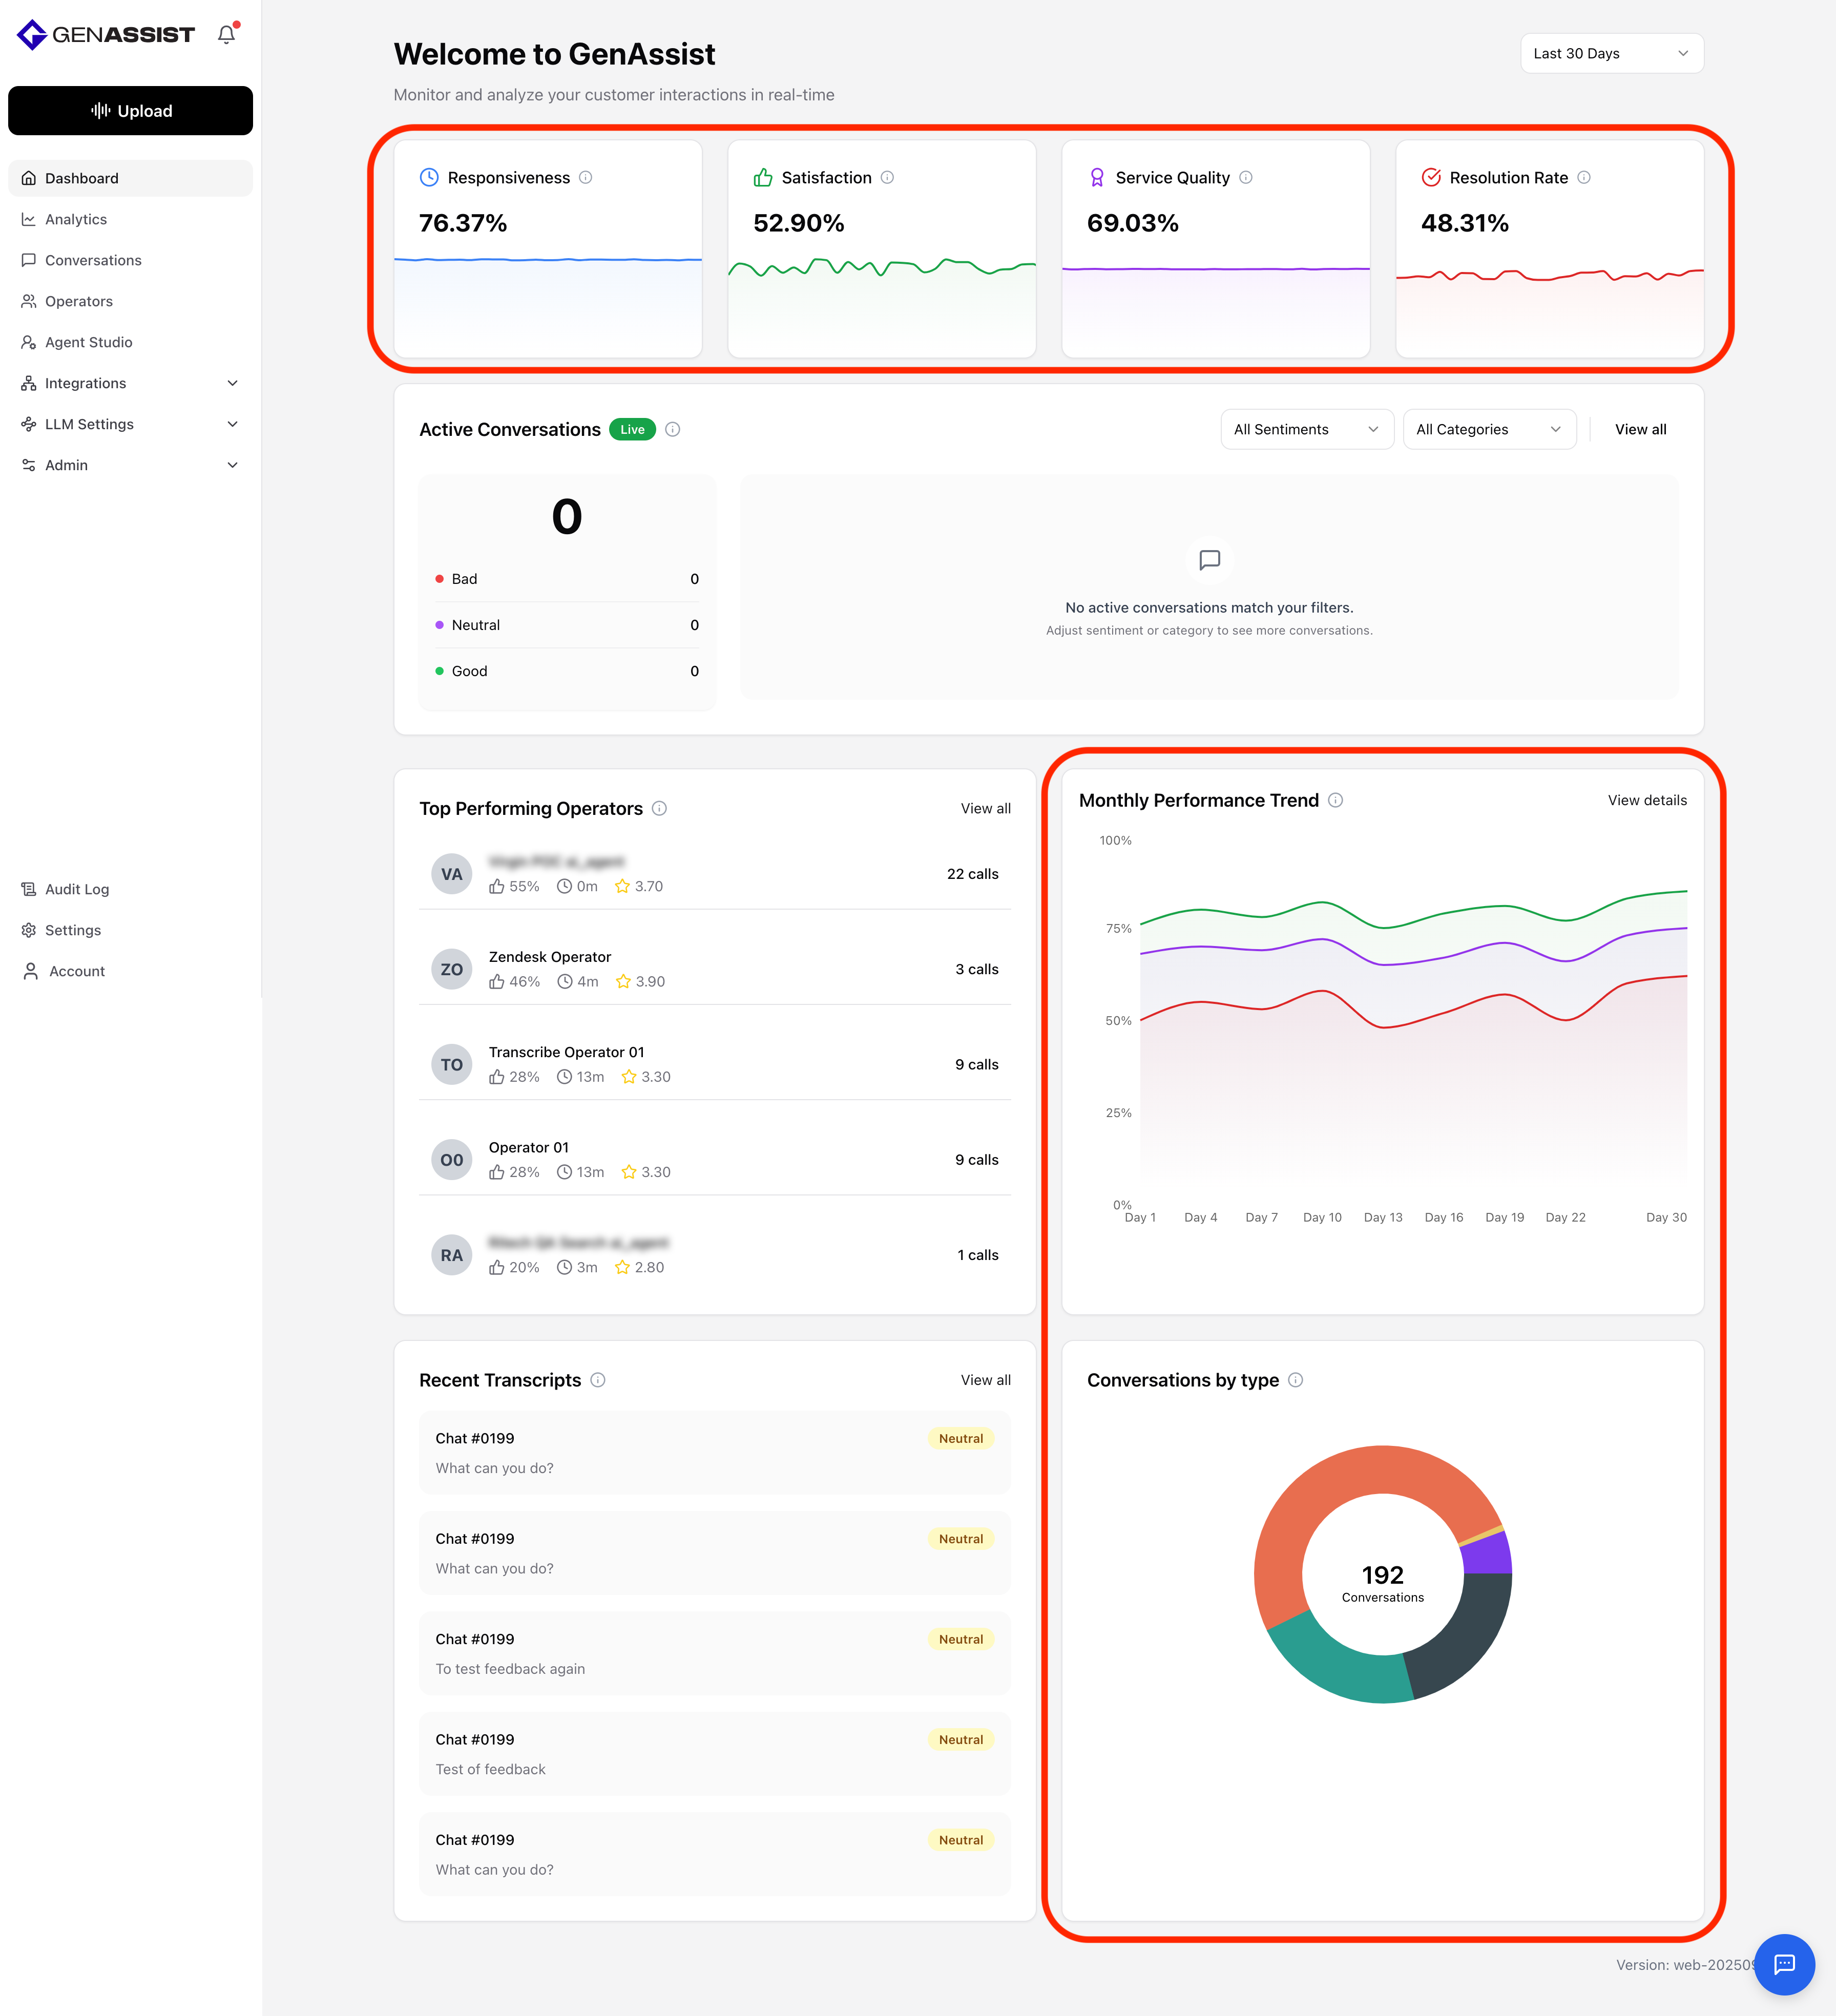
The Dashboard provides a set of charts and aggregated metrics to track overall performance. At the top of the Dashboard, four line charts visualize key metrics over time.
- Responsiveness measures the average time it takes for agents to respond to customer inquiries, where lower values indicate faster support.
- Satisfaction tracks the percentage of customers reporting a positive experience with the service, where higher percentages reflect better relationships and outcomes.
- Service Quality measures performance against internal quality standards, ensuring consistent delivery according to company benchmarks.
- Resolution Rate shows the percentage of issues resolved on first contact, with higher rates indicating more effective issue handling.
Complementing these charts, the Monthly Performance Trend aggregates key performance indicators, including satisfaction, service quality, and resolution rate, and shows how they evolve over the selected date range. This makes it easy to identify improvements, declines, or seasonal variations.
The Conversations by Type section provides a breakdown of interactions grouped by category. There are four categories, namely: Product Inquiry, Technical Support, Billing Questions, and Other. This helps teams understand the distribution of customer needs and allocate resources effectively.
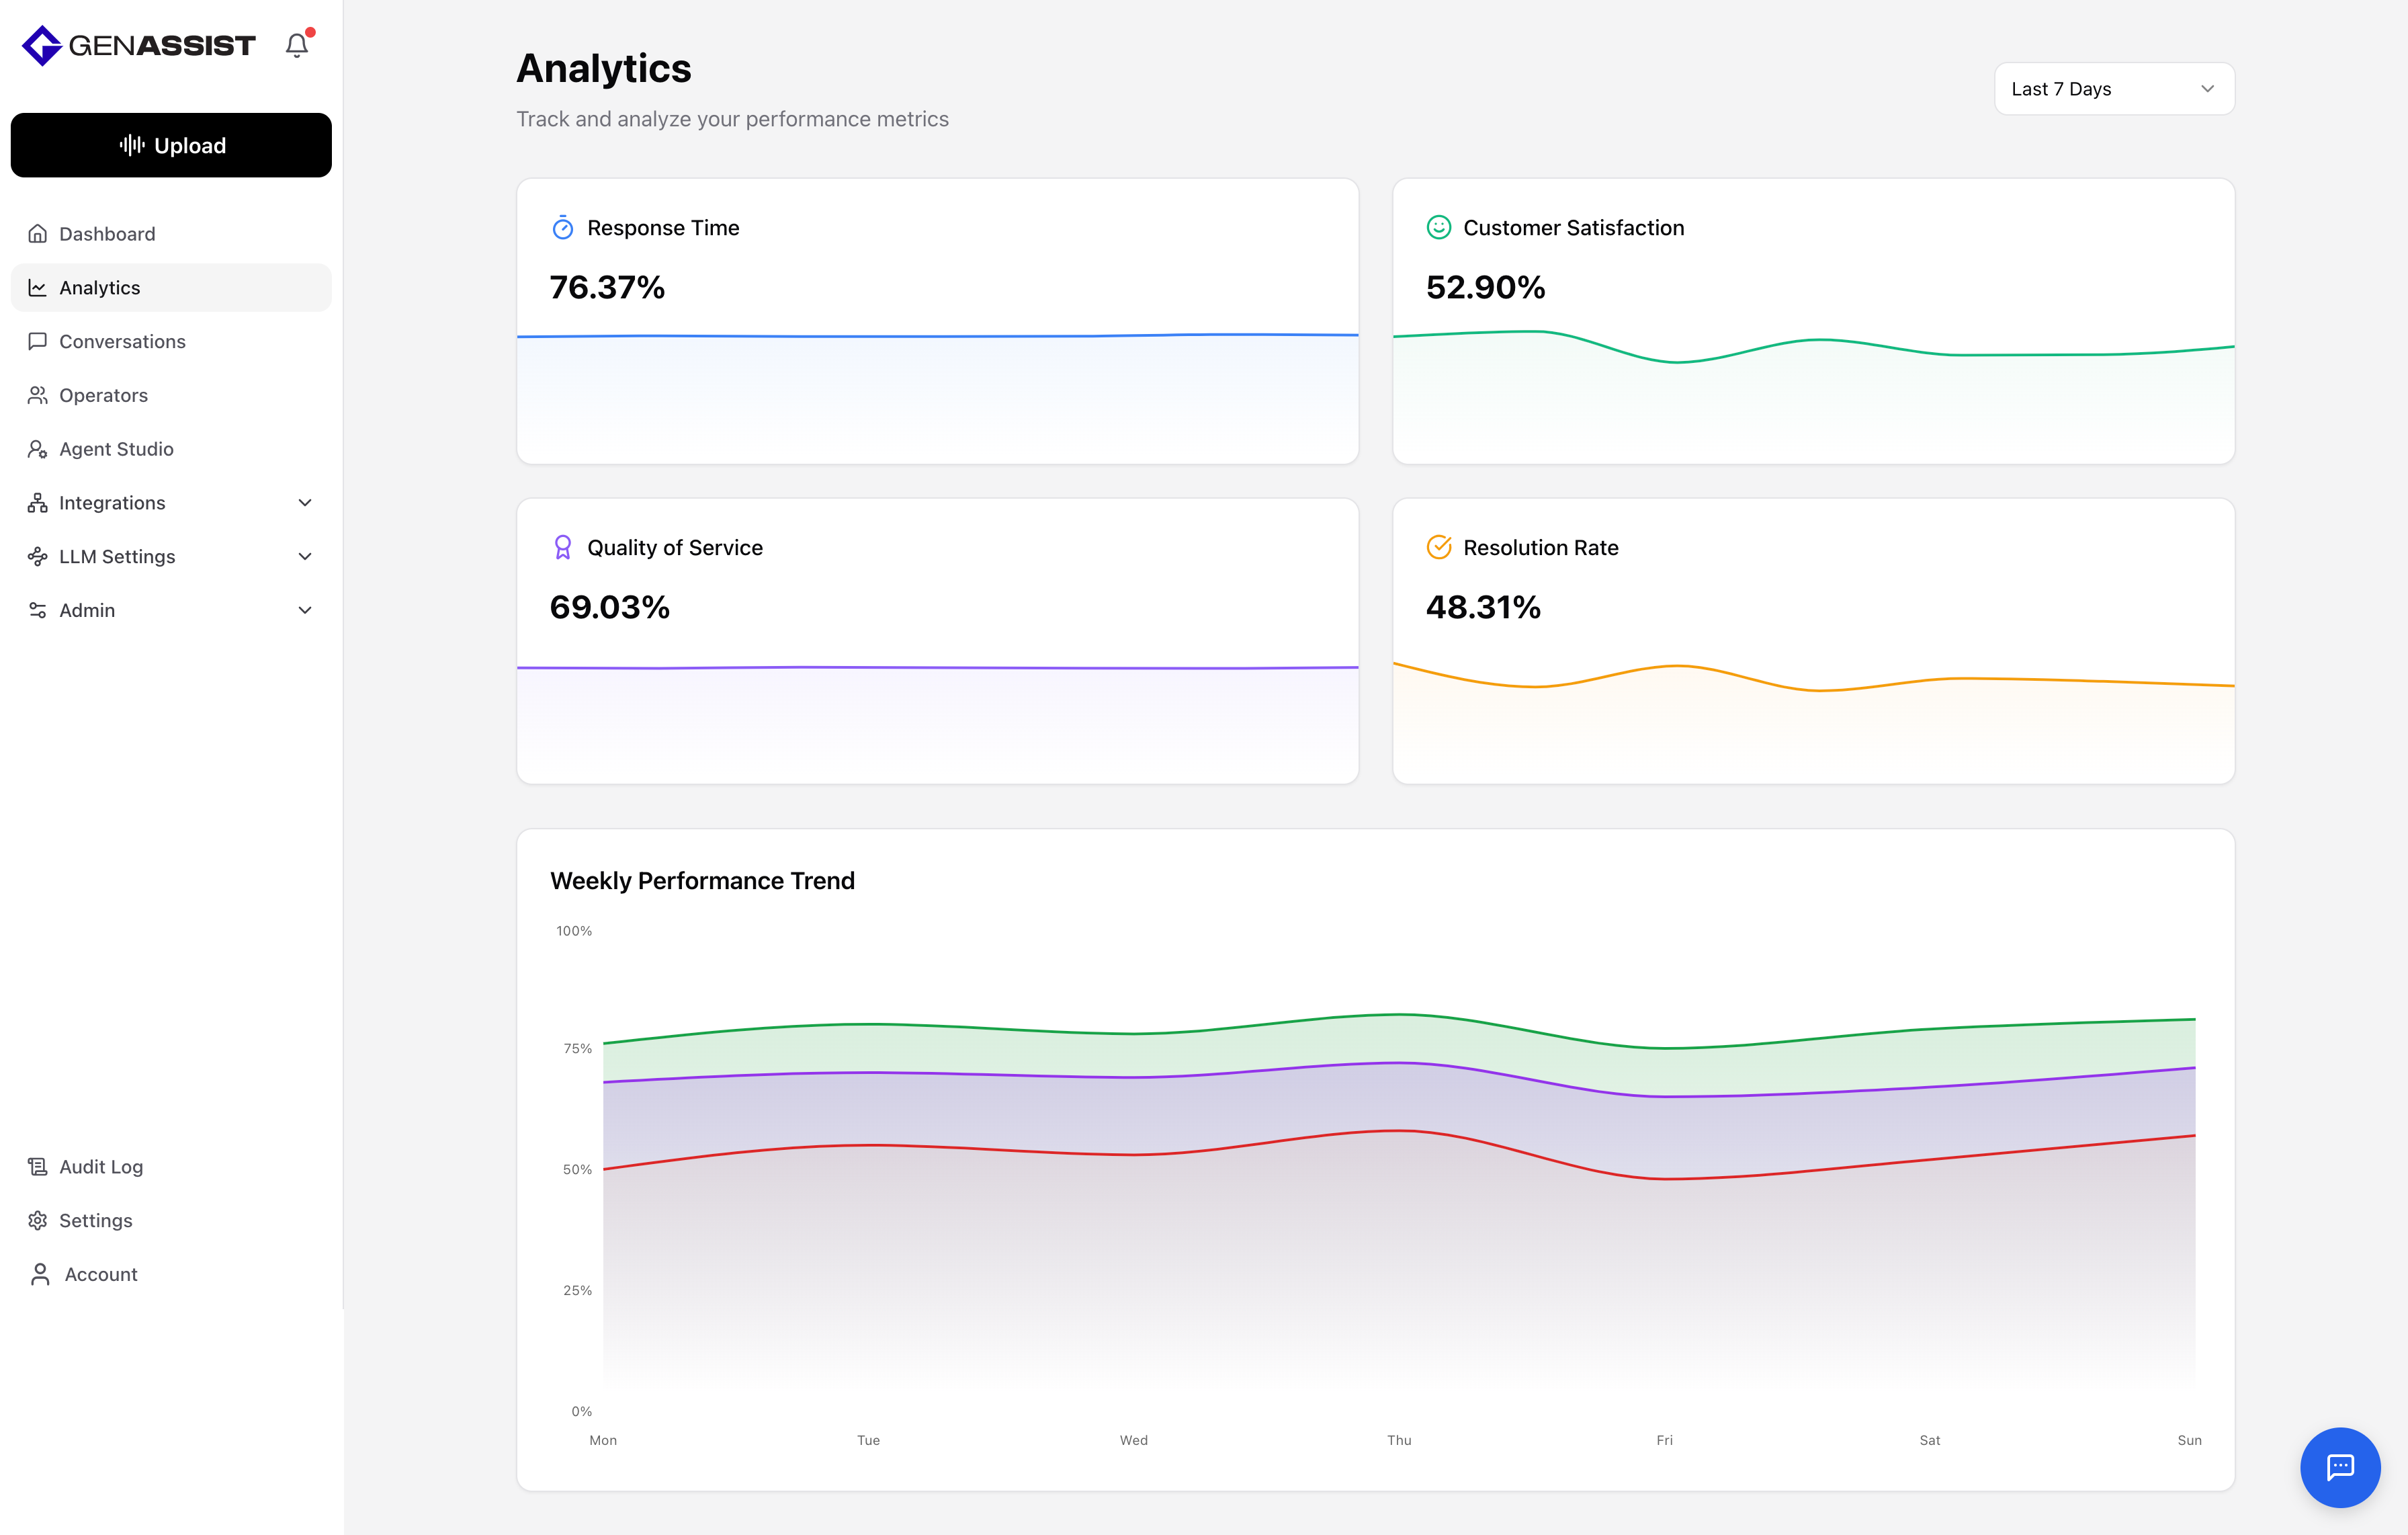
In The Analytics Tab
The Analytics tab provides a focused view of the four key metrics, along with a Weekly Performance Trend. This makes it easy to track short-term changes in performance without the additional breakdowns and charts available in the Dashboard.